Custom dashboard in HTML/CSS or Power BI: when to use each (or both)
Custom dashboard in HTML or Power BI? Compare design, licensing, performance, security and maintenance, and see when a hybrid approach pays off.
In short
- Power BI is the best choice when people need to explore, filter and drill into data, and it can also live inside the client's portal or system with Power BI Embedded.
- A custom dashboard in HTML, CSS and JavaScript makes more sense when the experience must follow the product design exactly or when the volume of access makes dedicated capacity expensive.
- Licensing changes the math: Power BI charges per user or for dedicated capacity, while a web dashboard has development and hosting costs, with no per-viewer license.
- The hybrid approach uses the same data model to feed Power BI for the internal team and a web dashboard for clients and partners, with the same numbers.
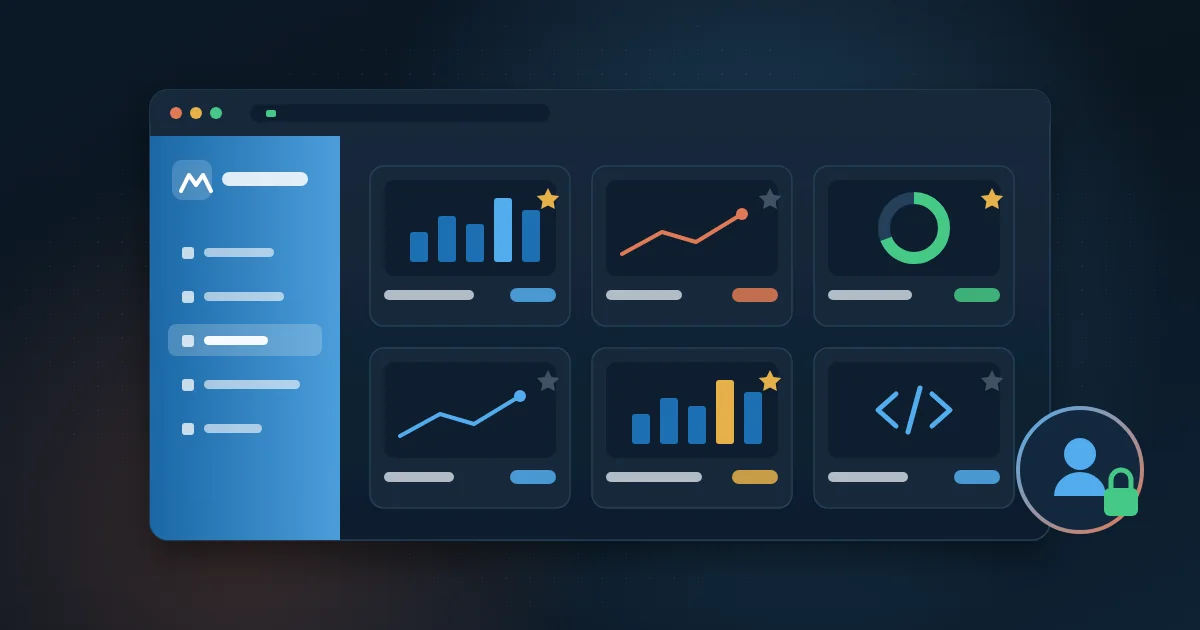
When a company decides to show data in dashboards, the first tool that comes to mind is usually Power BI. That makes sense: it's powerful, connects to almost any source and many people already know how to use it. But there are situations where a custom dashboard, built in HTML, CSS and JavaScript, works better, especially when the dashboard goes outside the company.
The short answer: both options can live inside your portal, system or product. Power BI goes in embedded, with Power BI Embedded, its own login and per-client access, and it is the best choice when people need to explore data with ready-made filters and drill-downs. A web dashboard in HTML/CSS makes more sense when the experience is fixed and must follow the product design exactly, or when the volume of access makes dedicated capacity expensive. The decision is about how the dashboard will be used, not where it lives. In many cases, the best solution uses both on the same data model.
Below you'll see the differences in design, interactivity, performance, maintenance, licensing and security, with a checklist to help you decide. If you want to explore dashboards hands-on before reading, open our interactive examples gallery.
What is a custom dashboard in HTML, CSS and JavaScript?
It's a dashboard built as a web page or application. HTML structures the content, CSS defines the look and JavaScript handles the charts and interaction, usually with visualization libraries. Data arrives through an API, which is the layer that queries the database and returns only what each user is allowed to see.
In practice, it can be a page inside the client portal, a screen in your internal system or a dashboard on the operations floor TV. Because it's software, it does exactly what it was designed to do, no more, no less.
Power BI or web dashboard: what are the differences?
Design freedom
Power BI allows themes, colors and layouts, but within the tool's visuals and grid. A web dashboard has no such limit: typography, animations, mobile-responsive layout and components specific to your business, such as a map of solar plants or a timeline of customer interactions, follow your product's design exactly.
Interactivity and exploration
Here Power BI usually wins. Cross-filtering, hierarchy drill-down, slicers and the ability to create new views without coding come out of the box. In a web dashboard, every interaction has to be developed. That works very well when the questions are known and repetitive, and becomes limiting when users need to investigate freely.
Performance
Power BI performance depends heavily on the data model and on DAX measures, the tool's calculation formulas. A web dashboard can be very lightweight, because it loads only the data and components needed for that screen, but that requires well-designed queries and APIs. In both cases, a poor data model produces a slow dashboard.
Maintenance and who can edit
In Power BI, the company's own analysts can adjust measures, create pages and publish new reports. In a web dashboard, changes go through developers, with code versioning, testing and deployment. That means less autonomy for analysts and more control over what reaches the end user.
How does licensing work for each option?
Power BI has two main models. With per-user licensing, each person who publishes or consumes shared content needs an individual license. With dedicated capacity, the company purchases processing resources, such as Microsoft Fabric or Power BI Embedded capacities, and the cost depends on the size of the capacity, not just on the number of people.
Power BI Embedded puts the reports inside the client's portal, system or product, with their brand around it, their own login and row-level security for each client. Viewers do not need a Power BI license: the application authenticates on their behalf and the capacity is sized for the volume of access.
A web dashboard has no per-viewer license. The cost lies in development, hosting and maintenance. For a few internal users, per-user licenses are usually the simplest path. For hundreds or thousands of external users, it's worth comparing dedicated capacity with your own web solution.
Which option is more secure for external client data?
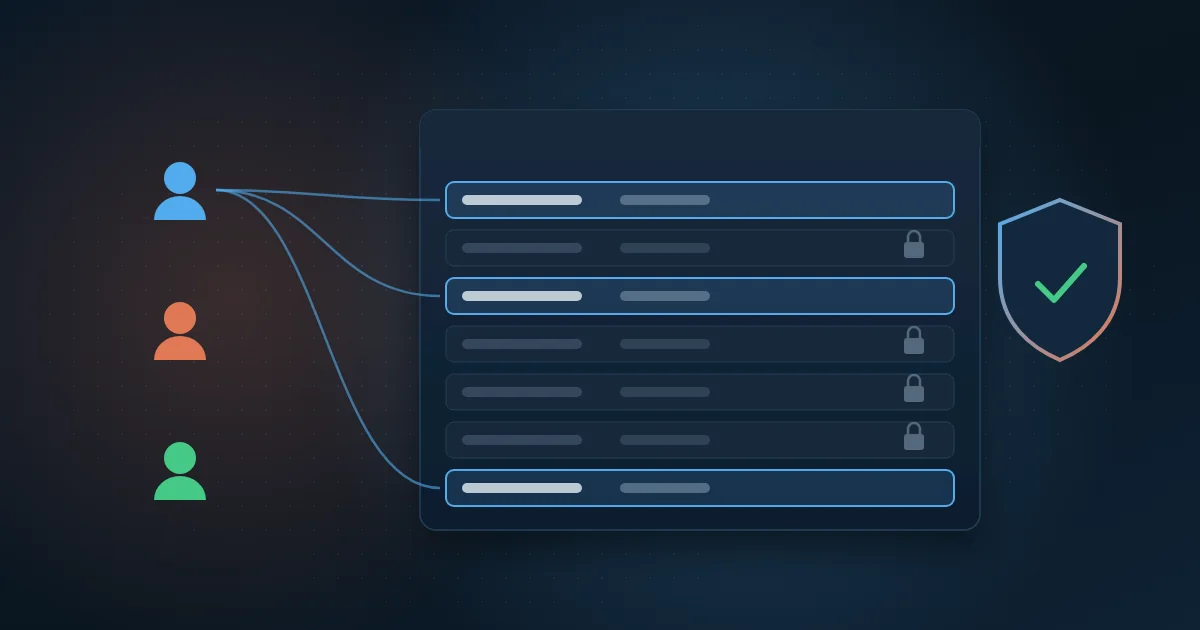
Both can be secure. The difference is where the rules are applied. In Power BI, row-level security, or RLS, filters the model's data according to the user, so each client sees only their own information. Learn how it works in the article on RLS in Power BI.
In a web dashboard, filtering happens in the API: the server identifies the user, queries only the permitted data and never sends the browser what that user can't see. Login can use single sign-on, one-time access with the corporate account, through Microsoft Entra ID or Google. The classic mistake is loading all the data into the page and hiding it with JavaScript, which exposes other clients' information to anyone who inspects the browser.
In both cases, keep access rules in one place. At MasterSense, for example, an access app defines who sees what in the BI.
When should you choose Power BI and when a web dashboard?
Power BI is the best choice when
- The report can live in the Power BI Service, for the internal team, or embedded in your portal or system, for clients, with Power BI Embedded.
- Users need to explore data, filter, drill down and create new views.
- The company's analysts will maintain and evolve the reports.
- You need to deliver quickly on sources Power BI already connects to.
- Questions change often, as in financial and sales analysis.
A web dashboard is the best choice when
- The experience must follow the design of a portal, app or product exactly, with custom-built interactions.
- The visual identity and experience must match the rest of the product.
- There is a lot of external access and the Power BI Embedded capacity cost does not pay off for the expected use.
- The dashboard combines data with actions, such as approving, commenting or opening a ticket.
- Screens are fixed and questions are known, as in a contact center operations dashboard shown on a TV.
Can you use both? The hybrid approach
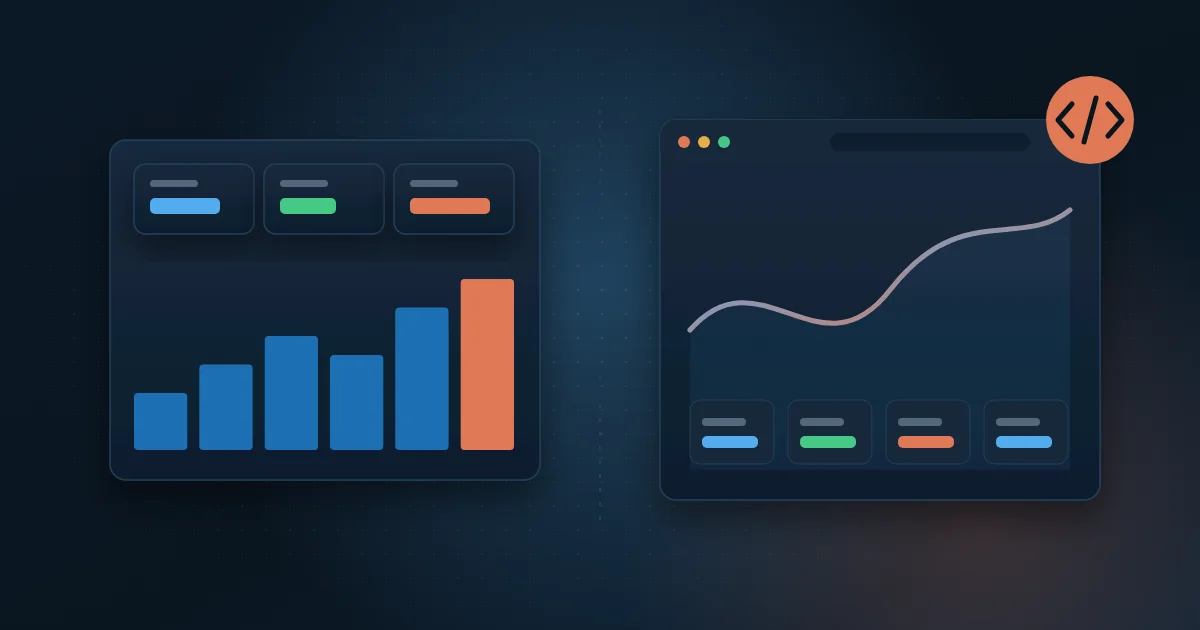
Yes, and it's often the most balanced solution. The idea is to have a single data layer, such as a data warehouse or a lakehouse in Microsoft Fabric, with metrics calculated in a standardized way. From there, Power BI serves the internal team and a web dashboard serves clients and partners.
An example in solar energy: the operations team analyzes generation, losses and billing in Power BI, while each client accesses a portal with the generation of their own plants and the allocated credits. In a contact center, managers explore metrics in Power BI and supervisors follow the queue on a web dashboard displayed on the floor. The number is the same on both screens, because it comes from the same model.
The critical point is not to duplicate business rules. If margin is calculated in DAX in Power BI and differently in the portal's API, the numbers will diverge. Centralize calculations in the data layer whenever possible.
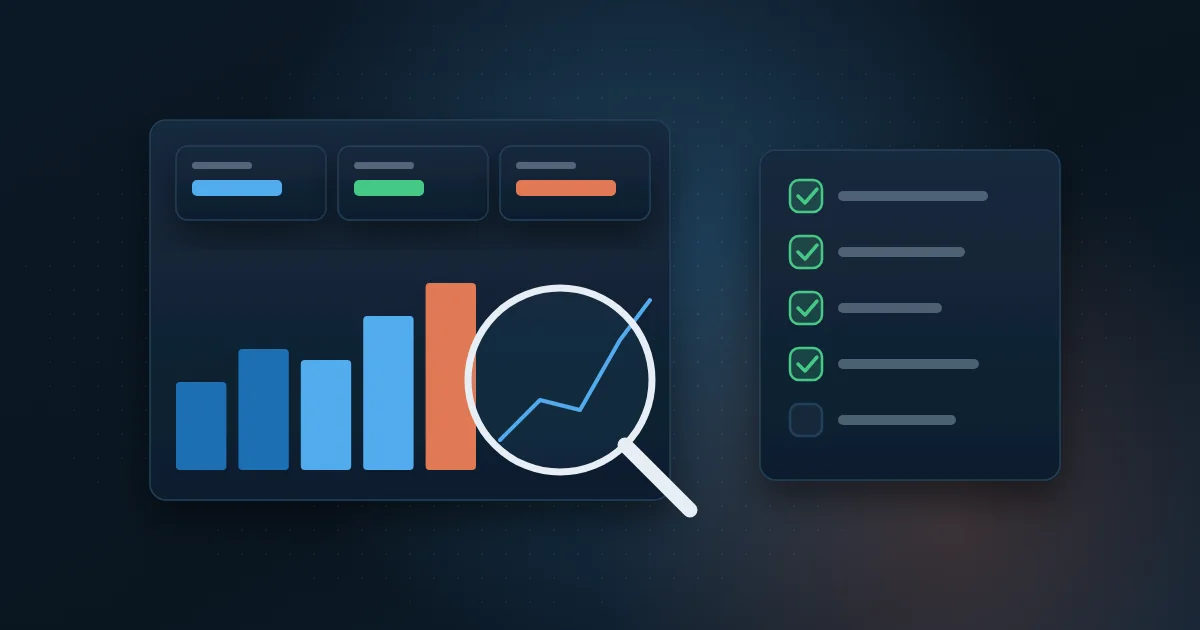
Checklist: Power BI or custom dashboard?
Answer the questions below. The more answers point the same way, the clearer the choice becomes.
- Use: will people explore the data with filters and drill-downs (Power BI, directly or embedded in your portal) or follow a fixed, well-defined view (web dashboard)?
- Number of users: dozens, where per-user licensing is viable (Power BI), or thousands, without individual licenses (web or dedicated capacity)?
- Design: is the tool's theme enough (Power BI) or must the dashboard follow the product's identity (web)?
- Exploration: do users create their own analyses (Power BI) or consume defined screens (web)?
- Editing: will business analysts maintain it (Power BI) or a development team (web)?
- Actions: does the dashboard only show data (either option) or does it need to record approvals and comments (web)?
- Security: are access rules defined and centralized, whether in RLS or in the API?
- Data: is there a single data layer able to feed both options?
How Wolkee helps
Wolkee builds dashboards in Power BI, Tableau and web in HTML and CSS, as well as custom systems with Microsoft Entra ID or Google login, access rules and approvals. Because the same senior team handles data engineering, the model that feeds Power BI can also feed your portal. We also embed Power BI reports in our clients' portals and systems, with login and per-client access.
If you're deciding between Power BI and a custom dashboard, book a free 30-minute assessment. We reply within 1 business day and, when it makes sense, show a working prototype before the contract.
Frequently asked questions
Do clients need a Power BI license to view an embedded report?
No, when the report is embedded in the model where the application controls access. In that scenario, your application authenticates with Power BI and displays the reports to clients, who need neither an account nor an individual license. In return, the company purchases dedicated capacity, sized by usage volume, and must implement access rules carefully.
Can you build an HTML dashboard with real-time data?
Yes. A web dashboard can receive data in real time or near real time, by querying the API at short intervals or receiving updates through a continuous connection to the server. This is useful in operations such as contact centers, plant monitoring and logistics. The limit usually lies in the data source and the architecture, not in the page technology.
How much does a custom dashboard cost?
The cost depends on the number of screens, the number of data sources, access rules and the level of interactivity. Unlike Power BI, there's no per-viewer license, but there is development, hosting and maintenance. To compare with Power BI, consider the total cost over a few years, including licenses, capacity and hours of ongoing improvements.
Can you migrate from Power BI to a web dashboard later?
Yes, and migration is much simpler when the data lives in a separate layer, such as a data warehouse, rather than locked inside the Power BI file. In that case, the web dashboard consumes the same tables and metrics. If the rules exist only in DAX measures, you'll need to recreate them in the data layer or in the API.